Practical 7: POWER BI
18IT110: Maharshi Relia
Introduction
Power BI is a business analytics service by Microsoft. It aims to provide interactive visualizations and business intelligence capabilities with an interface simple enough for end users to create their own reports and dashboards. It is part of the Microsoft Power Platform.

What is Power BI
Power BI is a collection of software services, apps, and connectors that work together to turn your unrelated sources of data into coherent, visually immersive, and interactive insights. Your data may be an Excel spreadsheet or a collection of cloud-based and on-premises hybrid data warehouses. Power BI lets you easily connect to your data sources, visualize and discover what’s important, and share that with anyone or everyone you want.
Visualization types in Power BI
- Area charts
- Line charts
- Bar charts
- Column charts
- Combo charts
- Pie charts, Doughnut charts, etc.
and many more … check out here.
Features in Dashboard
- Fields Pane — Displays the tables, folders, and fields in your data that are available for you to use to create visualizations.
- Visualizations Pane — Where you can change visualizations, customize colors or axes, apply filters, drag fields, and more.
- Filter Pane — Where you can apply filters
- Report View or Canvas — Where visualizations are created and arranged.
- The report, Data, and Model views- You can switch between Report, Data, and Model views by selecting the icons in the left column.

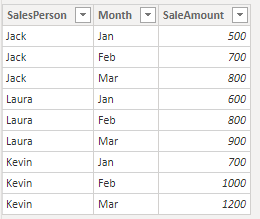
Dataset
A dataset is a collection of data that you import or connect to. Power BI lets you connect to and import all sorts of datasets and bring all of it together in one place. Datasets can also source data from dataflows. Datasets are associated with workspaces and a single dataset can be part of many workspaces.

Relationships on Finance Data set


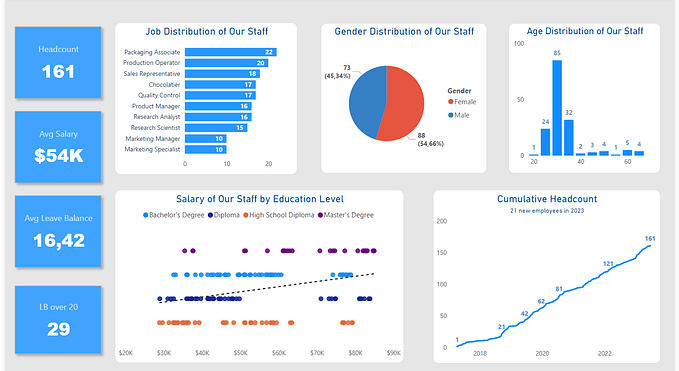
Visualizations
Visualizations (known as visuals for short) display insights that have been discovered in the data. A Power BI report might have a single page with one visual or it might have pages full of visuals. In the Power BI service, visuals can be pinned from reports to dashboards.


Do not copy this blog and its content as these are the personal copyright content under the MS Power BI account: 18IT110@edu.charusat.org
Happy Data Mining & Visualizing :)